
Python-Based Motorsport Data Dashboard
Project Overview
Developed to support race weekend analysis for Simon Green Motorsport, the dashboard brings together timing data, race position, sector performance, class results, and VBOX telemetry, allowing useful information to be reviewed instantly after a session. With the ultimate aim of making the data analysis fast, with a clear warnings/alarms page, making it clear what to look into first. While running such a limited group of people per car, time is key, thus pointing out areas or alarms to investigate, producing results faster than manual data analysis would be beneficial.
The aim of the project is to make data analysis more accessible and efficient during race weekends. Instead of manually searching through timing sheets or raw data files, the dashboard helps highlight trends, compare laps, and identify areas that may need attention.
Why I Built It
During a race weekend, useful information is spread across timing sheets, results, driver feedback, and telemetry files. With limited time between sessions, this data needs to be reviewed quickly.
I built the dashboard to organize information into a clearer, more repeatable workflow, making it easier to understand lap performance and spot trends across a session.
Timing Data Analysis
The timing section processes Britcar timing documents and organizes the results by session.
Cars can be compared using lap times, sector performance, race position, and time to a selected reference car. Safety Car and Full Course Yellow laps can also be identified, so they do not distort the performance analysis.
VBOX Data Processing
The VBOX section converts raw telemetry files into individual laps that can be compared within the dashboard.
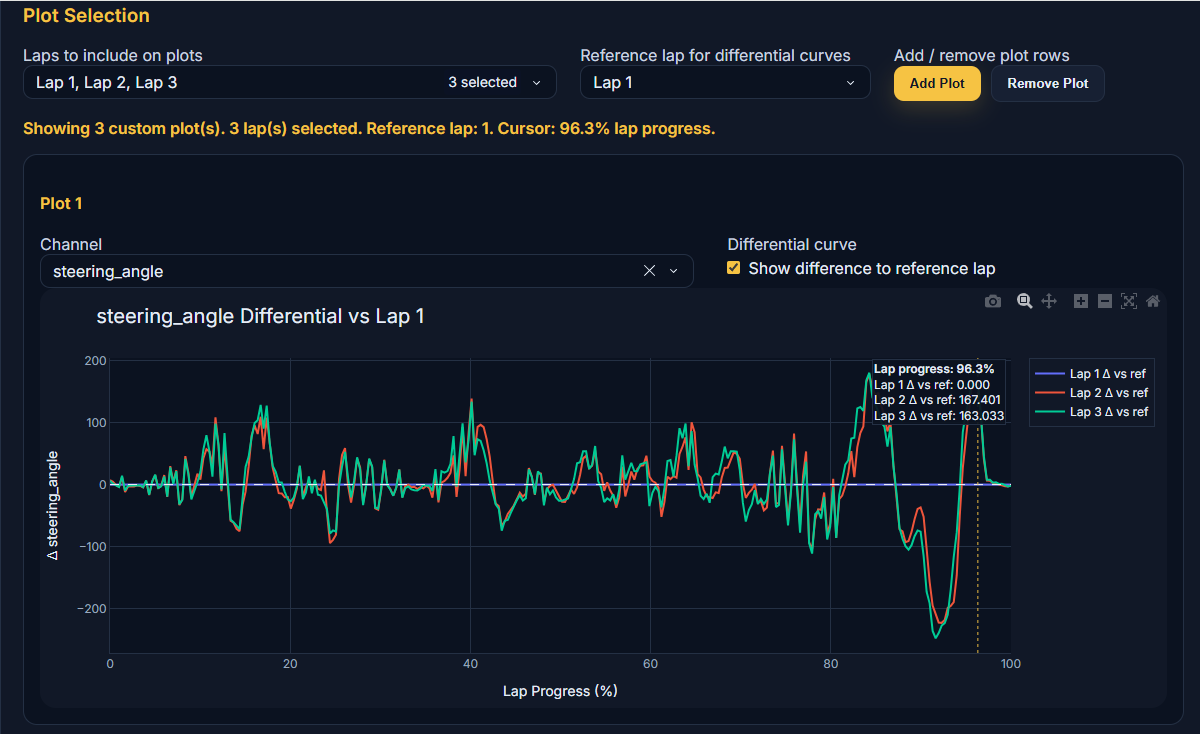
Users can select laps, choose a reference lap, and plot channels such as brake pressure, steering angle, speed, and throttle position. The data is displayed against lap progress, allowing the same areas of the circuit to be compared between laps.
Race Weekend Usability
The dashboard is designed to be quick and easy to use after a session. Sessions, cars, laps, reference data, and telemetry channels can all be selected without editing the code.
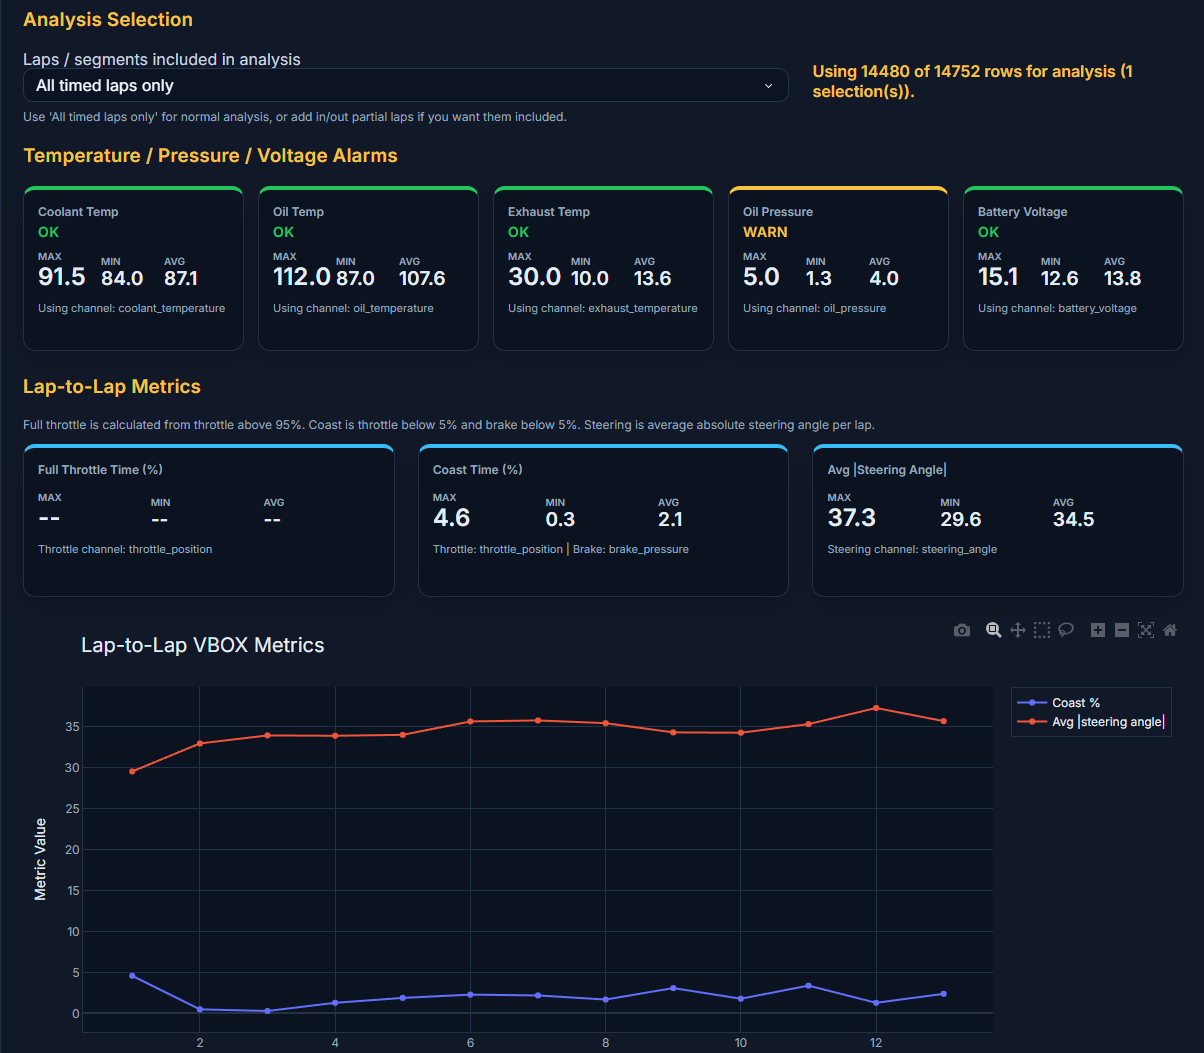
Summary cards also display key temperatures, pressures, voltage values, and driving metrics so that possible issues can be identified before looking deeper into the data. This is a key area I would like to improve.
Tools Used
Development: Python, Dash, pandas and Plotly
Data: Britcar timing documents and VBOX telemetry
Analysis: Lap comparison, sector analysis, reference deltas and vehicle monitoring
Current Progress
The dashboard can currently process timing data, organise session results, compare competitors, and display lap and sector trends.
The VBOX workflow can detect laps, compare selected telemetry channels, display differences to a reference lap, and produce vehicle-condition and driver-input metrics.
Next Steps
The next stage is to continue testing the dashboard with race-event data and improve its usability.
This includes refining the warning limits, improving lap filtering, adding more useful performance metrics, and making the import and analysis process quicker between sessions.
Final Goal
To combine the learning of programming using Python, which I am still new to, and the race weekend experience, to solve a simple problem within the team. It has allowed growth in both fields so far, and I am hoping to develop it fully by the end of the season.